DenInDen
New member
- Joined
- Nov 14, 2017
- Member Type
- Student or Learner
- Native Language
- Russian
- Home Country
- Russian Federation
- Current Location
- Russian Federation
Chart 4

The table illustrates distribution of people of different ages across six type of free time activity. Overall, major of public prefer to rest with watching TV or videos. The lowest group of people spend their time in Cinema. Adolescent have more free time then the other part of society.
According to the information from table, it’s clearly that teens prefer the group exercise and sport more than other people in the other ages, 450 and less than 350 respectively. It’s also noticeable that socializing with large amount of people are chosen the most (at 350) by humans under 30.
In terms of socializing in small group, 30s people are the most involved in at 300 persons. Also, people between 30 and 50 participate in individual exercise more than people in other age group, 200 compared with less than 150 humans.
The most interesting thing that people do not choose cinema as frequent as other activity, it makes up about 5% in each age group. (166 words)
Chart 5
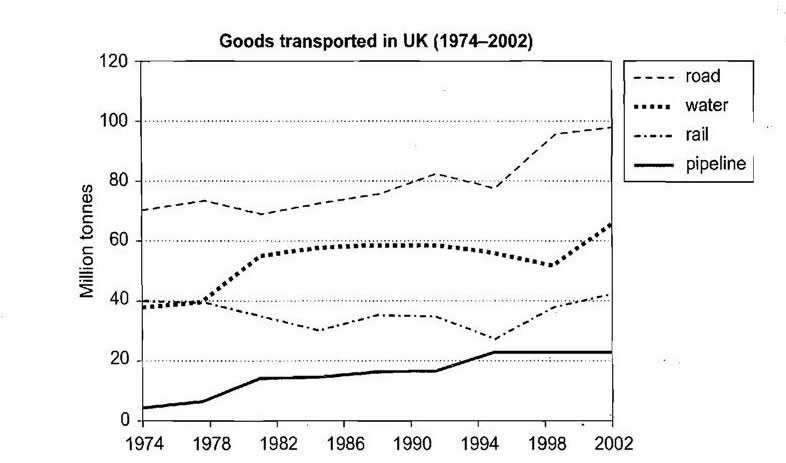
The line graph shows change in the products transportation among 4 diverse ways in UK. In general, there was a slight rise in the weight of transported goods over all kind of shipping. The lowest amount of product was transported by pipeline. In contrast, majority of goods was shipped by road.
According to the information from the line graph, pipeline way of transportation increased steadily over all period from approximately 5 to over 20 Million tonnes. It can be noticed that, transportation by rail ways was oscillated in range from about 30 to almost 40 million tonnes.
With regarding to water ways, there was an approximate 50% growth from rough 40 to over 60 million tonnes, it also showed remarkable behavior, as there was a sharp upsurge between 1974 and 1982, but after it there was a plateau.
In terms of road way transportation, about the half of goods in 2002 was transported by this system. Moreover, it’s started in 1974 at about 70 million tonnes rose nearly over all period and finally it reached a peak approximately 100 million tonns in 2002. (183 word)
The table illustrates distribution of people of different ages across six type of free time activity. Overall, major of public prefer to rest with watching TV or videos. The lowest group of people spend their time in Cinema. Adolescent have more free time then the other part of society.
According to the information from table, it’s clearly that teens prefer the group exercise and sport more than other people in the other ages, 450 and less than 350 respectively. It’s also noticeable that socializing with large amount of people are chosen the most (at 350) by humans under 30.
In terms of socializing in small group, 30s people are the most involved in at 300 persons. Also, people between 30 and 50 participate in individual exercise more than people in other age group, 200 compared with less than 150 humans.
The most interesting thing that people do not choose cinema as frequent as other activity, it makes up about 5% in each age group. (166 words)
Chart 5
The line graph shows change in the products transportation among 4 diverse ways in UK. In general, there was a slight rise in the weight of transported goods over all kind of shipping. The lowest amount of product was transported by pipeline. In contrast, majority of goods was shipped by road.
According to the information from the line graph, pipeline way of transportation increased steadily over all period from approximately 5 to over 20 Million tonnes. It can be noticed that, transportation by rail ways was oscillated in range from about 30 to almost 40 million tonnes.
With regarding to water ways, there was an approximate 50% growth from rough 40 to over 60 million tonnes, it also showed remarkable behavior, as there was a sharp upsurge between 1974 and 1982, but after it there was a plateau.
In terms of road way transportation, about the half of goods in 2002 was transported by this system. Moreover, it’s started in 1974 at about 70 million tonnes rose nearly over all period and finally it reached a peak approximately 100 million tonns in 2002. (183 word)