hardyweineberg
Member
- Joined
- Jun 3, 2022
- Member Type
- Student or Learner
- Native Language
- Igbo
- Home Country
- Nigeria
- Current Location
- Nigeria
This is my IELTS task 1 essay, and I have a few questions.
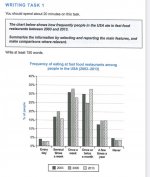
The table illustrates how many times Americans went to fast food restaurants in the years 2003, 2006, and 2013.
Overall, it is clear that most Americans ate at fast food restaurants once a week or once or two times a month. Also, while the proportion of Americans who visited these restaurants once or twice a month and the percentage who visited a few times a year both increased over the given period, the figures for the other categories fell.
In 2003, around 31% of Americans ate in fast food restaurants once a week, compared to about 18% who went several times a week, 5% who never went, and about 3% who went every day. By 2013, all these figures had reduced, with the percentage who went once a week dropping to roughly 28% in 2013 despite a slight rise to approximately 33% in 2006, when it was the highest figure.
Regarding the other categories, 30% ate in fast food restaurants once or twice a month, and after this proportion decreased considerably to 25% in 2006, it grew considerably to around 33%, becoming the highest figure. Additionally, the figure for “a few times a year” rose marginally from nearly 13% in 2003 to 15% in 2006 and then remained stable.
1) Is my introduction okay?
2) Is it okay to say "the figures for the other categories" and "the figures for 'a few times a year'"?
3) Can I refer to a decrease of 5% as "considerable" because it appears big on the graph?
4) Did I "sufficiently" summarise the information on the bar chart?
Attachments
Last edited: