mrmvp
Senior Member
- Joined
- Jul 13, 2017
- Member Type
- Student or Learner
- Native Language
- Arabic
- Home Country
- United Arab Emirates
- Current Location
- United Arab Emirates
I am preparing for IELTS exam writing. Which sentences is the best paraphrase the below sentence?
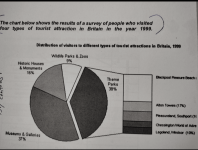
The chart below shows the results of a survey of people who visited four types of tourist attraction in Britain in the year 1999.
1-The pie chart illustrates the fiqures for visitors to four categories of tourist attraction and five different theme parks in 1999.
2-The pie chart illustrates the fiqures of visitors to four categories of tourist attraction and five different theme parks in 1999.
3-The pie chart illustrates the fiqures of visitors to four categories of tourist attraction and to five different theme parks in 1999.
If you can provide me with better paraphrase, this is very kind of you. The pie chart image is attached.