Thank you so much.
I mean you can't say 'the number of computer ownership' because it doesn't have a number[1], it's uncountable.
You just mean 'computer ownership', without 'percentage'.
1 But it has a percentage. I am really sorry for taking up your time.
I mean, why can't I describe the
percentage of computer ownership increased over the years given?
You don't need to say 'percentage'. You just mean Computer ownership increased ...
Please look at the graph once again, I highlighted the keys features including
percentage
I can't comment reliably on the rest of your sentence because I don't understand the chart well enough. What do the red and blue bars mean? I can't see the relationship between time and education level. Please post a picture of the entire chart, including the key.
The chart is attached with highlighted features
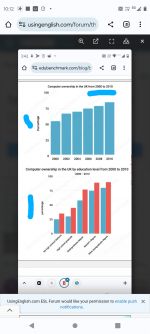
The first graph shows a gradual increase of computer ownership percentage from 2000 to 2010 Including all years
from 2000 to 2010
The second graph is a bit complicated
It is about the percentage of computer ownership in terms of educational level
The key difference between the two charts is that this graph in which blue figures represented 2000 while the red ones represented 2010
only two years
Unlike the first graph which started from 2000 to 2010, over the span of 10 years.
Not cause and effect exactly, no, but you can use it with changes over time, yes.
If I were being picky, I would point out that it isn't fully appropriate to talk of correlation in this case because one of the measures is time. It's more appropriately called a 'trend'. Correlation is when there's a relation between two data sets. The issue here is that what you're calling the advancing years (the period in question) is not a data set. To express the relational idea that you want, you can use the preposition with:
Computer ownership increased with time.
For a more or less equally simple expression of the same idea:
Computer ownership increased steadily over the period.
I highly agree with you that I should mention the time specified in the chart
Can I say the following?
1-Computer ownership increased with time given in the chart.
2-Computer ownership increased with time given in the trend.
3-Computer ownership increased with time span given in the chart.
Do I have to say
given in the chart/ trend or does it consider redundant?
The percentage of people who owned computers increased steadily over period.
If you want to talk about the relation between the rate of computer ownership and the education level of the owner, then that is a correlation, so you could say:
There was a positive correlation between computer ownership and education level.
Also, this is a great opportunity to use an impressive 'the ... the ...' correlation sentence. Here's just one way to do that:
The higher the level of education, the greater the likelihood of owning a computer.
Do I have to use "the people who" before "owned computers increased steadily over the period."
I mean I can talk about the percentage of computer ownership without adding in the beginning" the people who"
If you are familiar with Task 1, it is about describing charts.
Let's say I want I want to talk about
"The graph shows changes in the amount of fast food consumed in the UK between 1970 and 1990"
Here I added "the people who" as you did.
Do I have to say "the percentage of people who consumed fast food restaurants increased from 1970 to 1990"?
The question is why can't I talk about "the consumption of fast food restaurants"
Why isn't wrong to say?
The percentage of consumption fast food restaurants increased from 1970 to 1990.