AnaEng
Junior Member
- Joined
- Oct 9, 2018
- Member Type
- Student or Learner
- Native Language
- Arabic
- Home Country
- Kuwait
- Current Location
- Kuwait
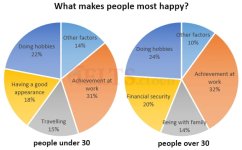
I am practicing for IELTS task 1, I want to compare two pie charts.
I want to say that being with family is the lowest category for people over 30 and travelling is also the lowest reason for happiness for people under 30.
I came up with these sentences:
1- Overall, achievement at work accounted for the largest proportion in both figures. Meanwhile, being with family was the lowest category for people over 30, and people under 30 believe traveling is the lowest reason for happiness.
2-Overall, achievement at work accounted for the largest proportion in both figures. In contrast, being with family was the lowest category for people over 30, people under 30 believe traveling is the lowest reason for happiness.
3-Overall, achievement at work accounted for the largest proportion in both figures, while being with family was the lowest category in people over 30, people under 30 believe traveling is the lowest reason for happiness.
4-Overall, achievement at work accounted for the largest proportion in both figures. In contrast, being with family was the lowest category for people over 30 and so were people under 30 believe traveling is the lowest reason for happiness.